

How To make Google Analytics Data publicly available and embed GA charts directly into your website page?
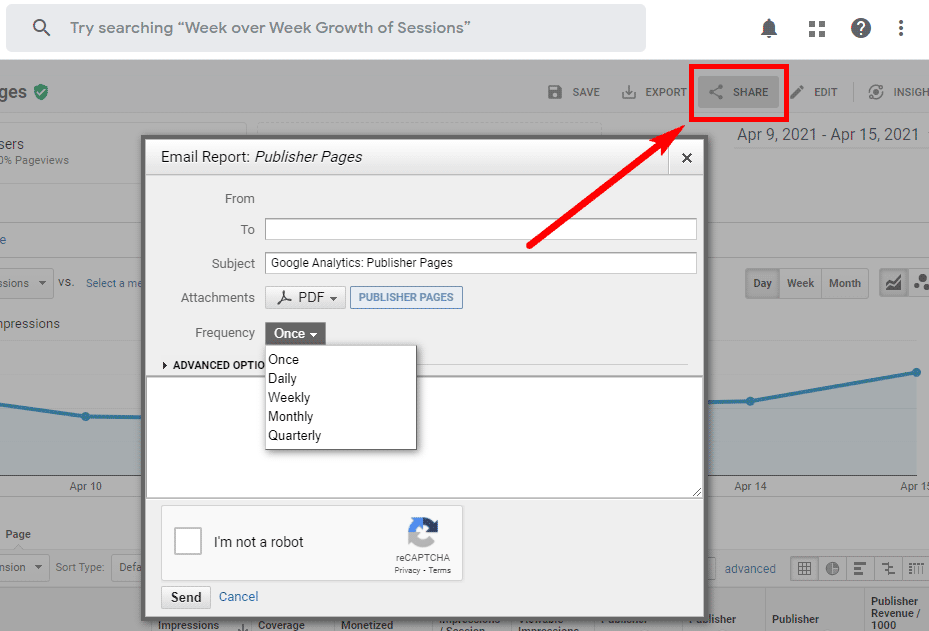
Google Analytics – Share Reports Feature via Email
- Sign-In into your Google Analytics Console
- From the menu click on ADMIN
- From drop-down menus select appropriate ACCOUNT and PROPERTY (app or website)
- Click on User Management section
- Click on + sign (top right) to add new account/user (with Gmail address)
- Set access level (for example Read & Analyze)
- Now, when they sign-in into their GMAIL/GOOGLE account (regularly), they will be able to also access Google Analytics (see step 1 link above) and access your Website/Property you’ve just shared! They will not be able to delete account with read-only permissions, but if you trust someone, you can grant them higher access level.
GOOGLE ANALYTICS SHARING
If you are not a programmer and have absolutely no idea how to use API (Application Programming Interface), there is an easier way to embed Google Analytics and make it publicly available thanks to the partnership between Google and 3rd party company called SeeTheStats.
Google Analytics
SeeTheStats allows users and webmasters to show Google Analytics stats directly into your websites, either to simply show off to your friends and visitors, or more serious business/marketing purposes.
You may, however, choose to make analytics data private (effectively only those who know the correct URL link to your statistics page can access it) or even public inside SeeTheStats’s website, so anyone can explore their online database.
SeeTheStats Google Analytics STEP-BY-STEP TUTORIAL
STEP 1. You need to create an account over at SeeTheStats.com, and during the middle process as part of a registration you will need to login into your Google Analytics page and allow access to SeeTheStats for your website (add one website at a time, if you have more). After that process is complete, you should see something like this:
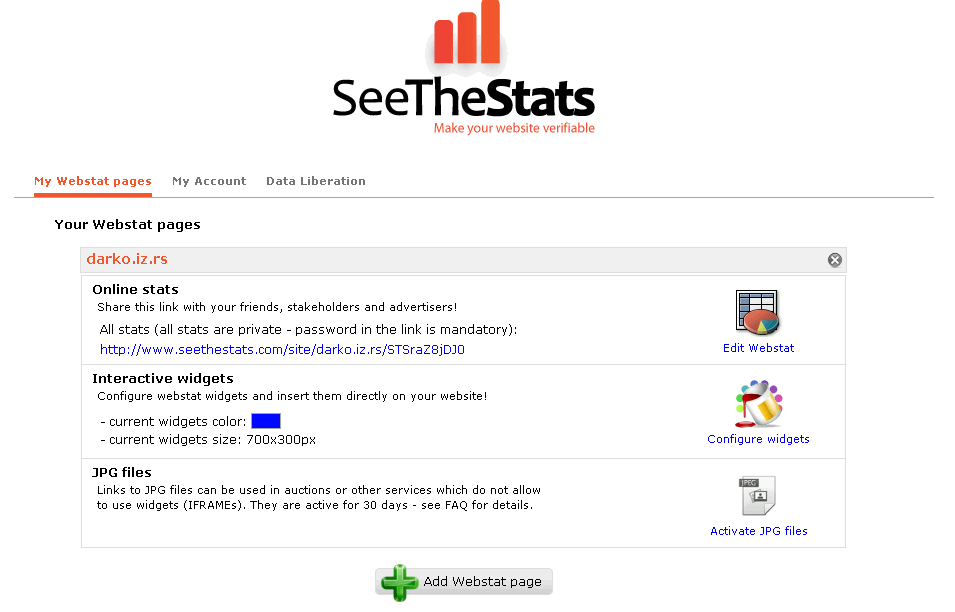
Google Analytics SeeTheStats Tutorial
STEP 1
(click to enlarge)
STEP 2. Click on Edit Webstat > you should see a page that will allow you to Drag-And-Drop all the available Google Analytics widgets (from left to right half of the table). Currently, up to 6 different widgets can be added at once. Choose what you like to show.
Notice the small checkbox ticks on the right, selecting this options will make your data private in the online SeeTheStats analytics database, so only users with the correct URL to your statistics page can access it.

Google Analytics SeeTheStats Tutorial
STEP 2
(click to enlarge)
STEP 3. You have an option to set time interval (use last 30 days by default or custom interval), then click on Update Webstats Page button.
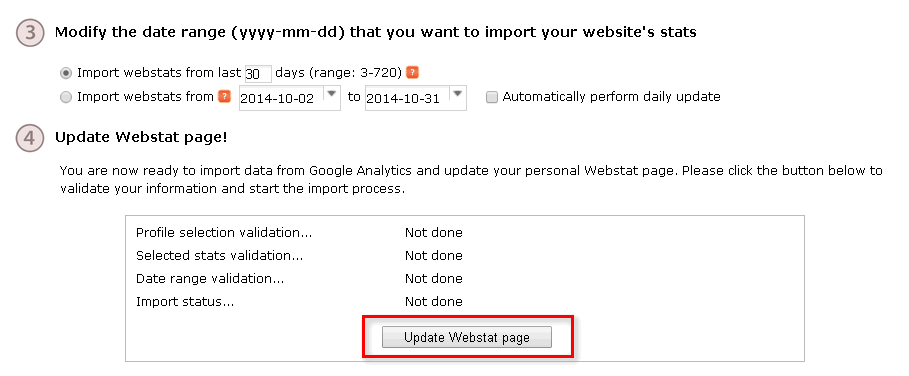
Google Analytics SeeTheStats Tutorial
STEP 3
(click to enlarge)
STEP 4. After updating the page, you should see an updated screen. You may share the private page with others, or proceed to the next stage, where you can actually embed individual widgets directly onto your website.

Google Analytics SeeTheStats Tutorial
STEP 4
(click to enlarge)
STEP 5. Return to My Webstats Pages and click on a second icon to Configure widgets:
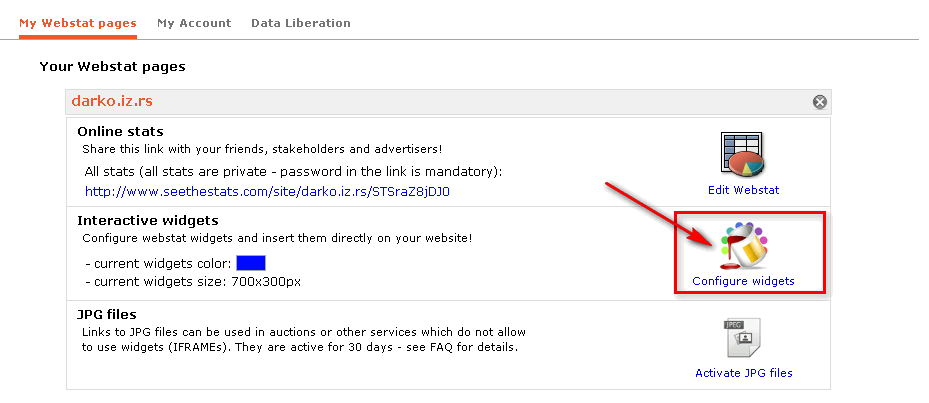
Google Analytics SeeTheStats Tutorial
STEP 5
(click to enlarge)
STEP 6. Here you can adjust the color of the widgets and set it to better blend with your general website design. When you are done with a single parameter setting, you may choose to copy individual iframe embed codes, or copy all at once at the bottom of the page.
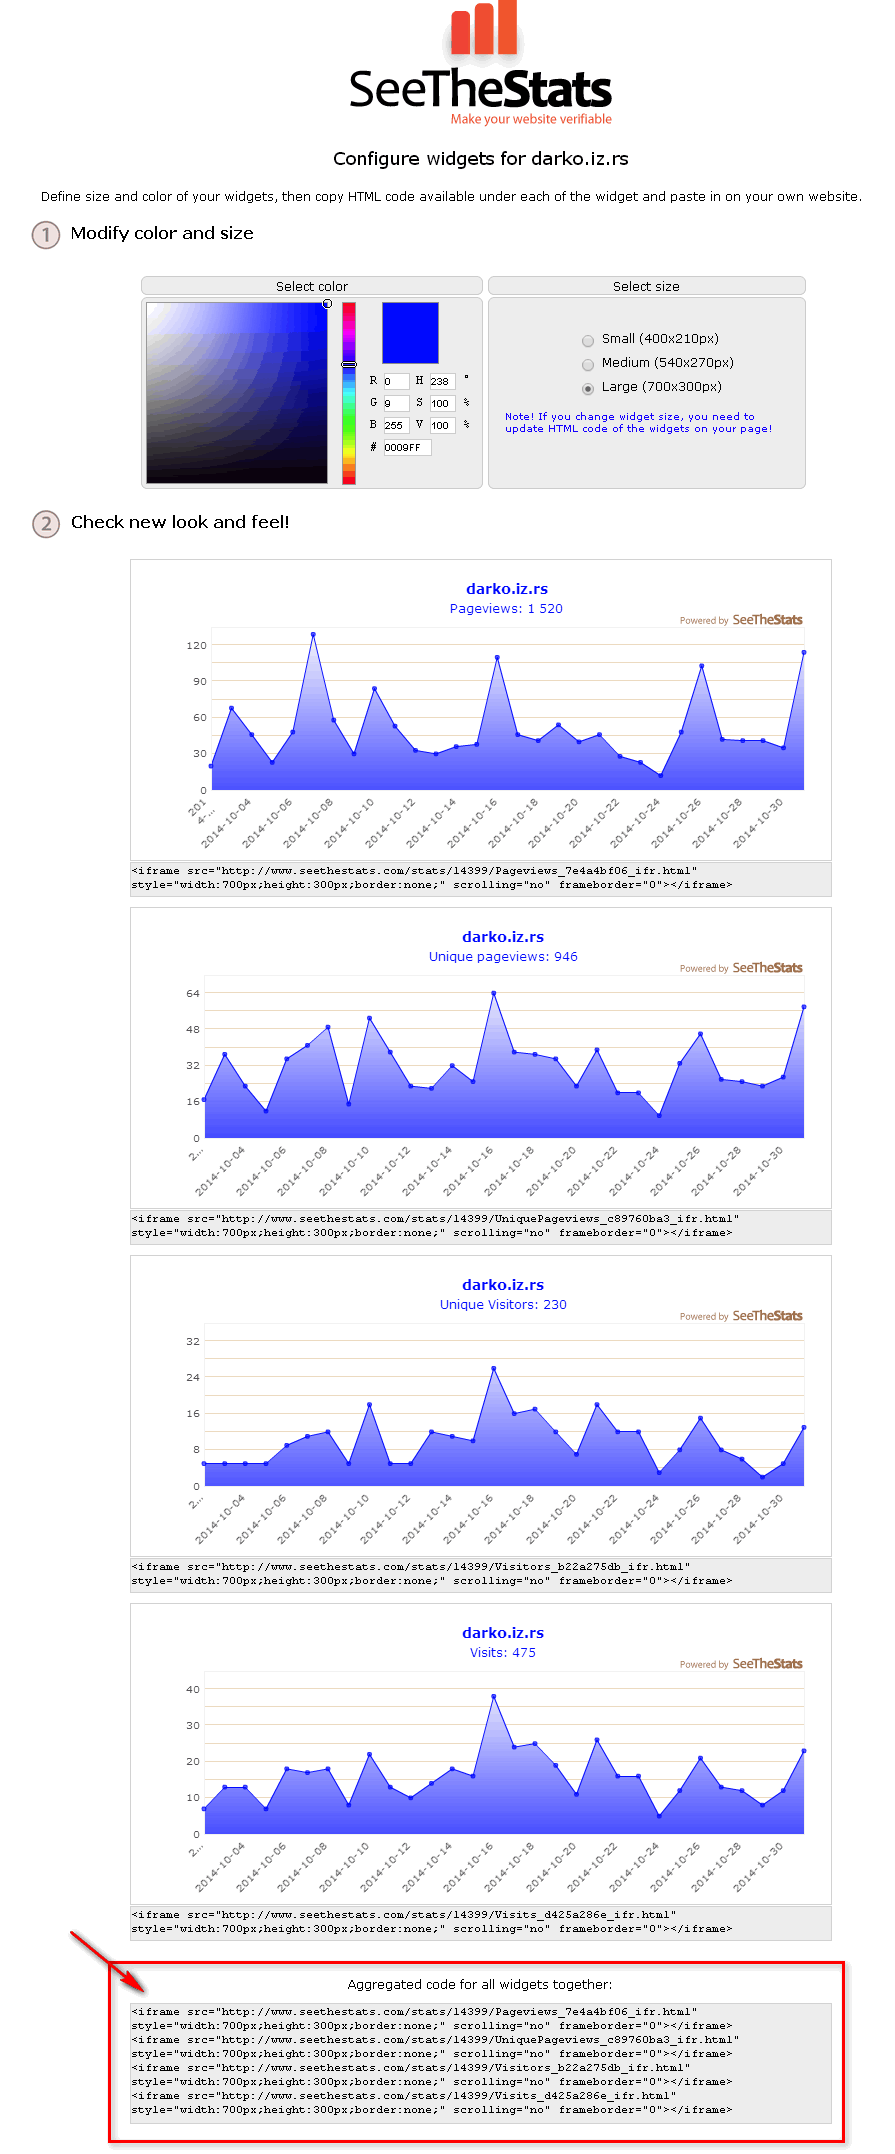
Google Analytics SeeTheStats Tutorial
STEP 6
(click to enlarge)
Paste this code into wherever you like and your data will be available to your visitors. Or, you may keep this URL link hidden from the public, and just use it for quick access to Google Analytics and internal purposes.
FINAL THOUGHTS
There are few thing to note here. Charts are generated using Adobe Flash technology, and have a fallback built-in for mobile devices which do not have support for the flash player plugin. However, the charts are not responsive currently, so this may be a little trade-off for your website design.
It would be better if they were built with Google Chart API or some jQuery library (jQuery Flot plugin, for example). But, in the end, it is very straight forward and very easy to implement.


![Xiaomi App - How To Re-Install Stock Factory Version - How To Fix Corrupted Gallery App [no root]](https://tehnoblog.org/wp-content/uploads/2025/09/Xiaomi-Gallery-App-Code-Bugs-Artwork-1024x576.png)


Comments
Post A Comment