

Article updated: 2018 Dec 30
This is NOT another simple jQuery browser window resizer tool you might expect!
Google Website PageSpeed Insights Tools recently went through a serious change. Google dropped the mobile responsive design test, and left only the speed test section. The Mobile Friendly Test was moved (merged) into Webmasters Tools Mobile Usability section, behind reCaptcha and login wall (apparently dropped at some point).
This is the main reason why we decided to build a small in-house jQuery (JavaScript) utility to streamline our website responsive design testing and debugging and more easily troubleshoot elements which fall outside the screen or ViewPort area.
RESPONSIVE WEBSITE DESIGN TESTING SCRIPT TOOL WITH JQUERY

Website Responsive Design
Goal / Idea
To build a simple ‘falls out of viewport’ script that will take anything into it and spit out meaningful results.
Why of Why?
Google steared some waters with their recent changes in many products and services (reCaptcha noCaptcha ditched support for Opera Mini and old factory browsers; Google Chrome App introduced suggested content ads instead of bookmarks and recent history shortcuts; Google Maps with geocoding stopped working without API key, and so on…).
We get it, it’s not a public service company, naturally trying to get profit from everywhere they can. In a way, reducing the PageSpeed Insights tool to loading tests and resources, leaving only the relevant speed test, is kind of natural thing. To be completely honest, page speed does not have anything in common with website responsive design, but this was not our biggest issue with the change, at all.
Mobile Friendly test was moved into WebMasters console. Problems? Well, now you need an account (mandatory) to access it, and even if you are already logged-in, it is placed behind a captcha wall! Oh, and you can test your own sites only (yes, initial test can be done on any site, but to access actual ‘reports’, you must be the owner). Personally, we don’t have any issues with all that. We have never (ab)used their API service(s), nor abused the non-api version of it anyway, so – at least in that regard – all is fine.
*Except* from the fact that the “new” tool is so much infinitely dumber than the old one.
Proof of concept: We’ve been working on a new project’s design, and one div element with class “row” had a problem falling outside the viewport. New Mobile Friendly Tool had absolutely no issues with the page (e.g. it only has “yes” and “no” answers, apparently – and the answer was “yes – this page is Mobile Friendly”). The old tool would report exact element that was falling outside screen’s area and we could easily fix it.
Truth to be told, in some rare cases, PSI reported wrong elements, as they were a consequence caused by some other, not directly related elements. But, it was still very useful starting point.
We have tried a test with some “free SEO” tool, but as it turned out, it was just an existing Google API tool. To be completely accurate, the free SEO tool report contained one important difference – it reported a (correct) warning that the content was indeed falling outside of ViewPort (something that original Google Mobile Test tool was ignorant about). All that we’ve already knew by ourselves, so nothing new was available for us to help us deal with the problem (understandably, as everything is now behind accounts and captcha wall, no more details were available through API, either).
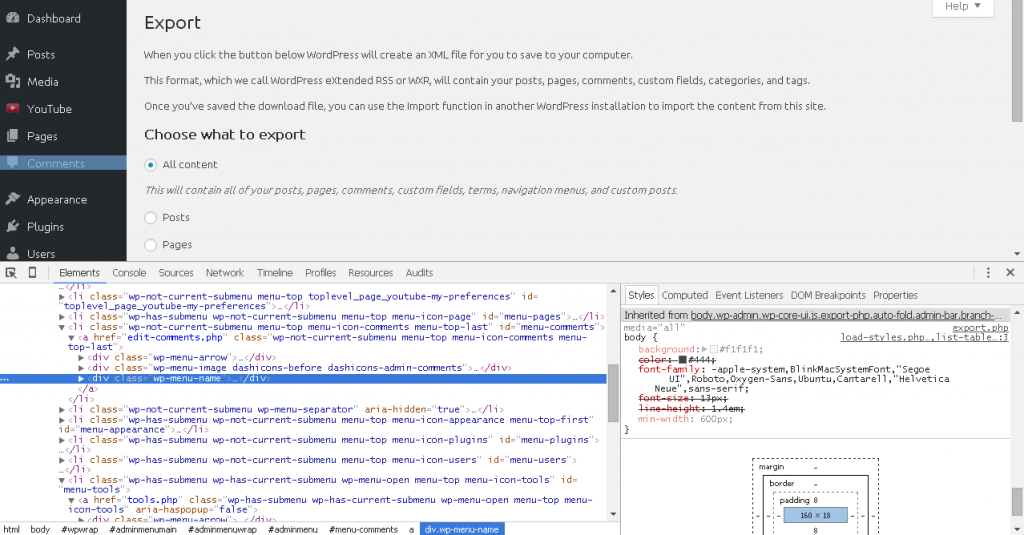
Furious and tired, we went back to our problem, and with no alternative, inspected each element in the DOM tree one-by-one to find above mentioned div with class “row” that had left/right margins of -10px added by bootstrap‘s main CSS template. The problem was easily fixed afterwards, but the bitter taste experience was still present, as this was much easier to do back in the old days (actually, just 2 weeks earlier, to be precise).
Fast forward to year 2018 and new Google Search Console: We occasionally receive charming New Mobile Usability issues detected for site message notifications to inform us about the fact that some content on some pages is wider than the screen size. And no details are provided about what elements and in what amount (pixels) exceeds the (unknown) screen size!
And, once again, when we test these page in Chrome’s Mobile-Friendly tool – we always receive correct Page is mobile friendly message report. Also, we just can’t reproduce it in DevTools mobile emulation or in physical phones and tablets using various models and browsers! It is very frustrating experience, to say the least. Some errors apparently resolve all by themselves in couple of days, which indicates that there are some rendering issues (bugs) in the new GSC console.
(is there a light at the end of the tunnel?)
Web Developer – A Google Chrome & Firefox Extension (Plugin)
Well, there is one simply called “Web Developer” (for Chrome, for Firefox) with a unique feature to show all div dimensions (widths and heights) on the page, but it is still not exactly what we were looking for.
There could be hundreds or thousands div html elements on the page, so you have to cycle through all of them manually with your own eyes, trying to spot rogue ones. Good luck with that!
Oh, and another problem: it works only for DIVs, if your element is something else (table, ul/li, link…) it cannot be traced this way.
Still, it is a great handy extension, nevertheless, available for both browsers, so you don’t have to make compromises and switchovers (yeah!).
(back to the drawing board)
jQuery Script Tool For Simple Responsive Website ViewPort Debug / Testing
We have looked into some PHP and JavaScript solutions to parse entire HTML documents, in case of PHP we have either built-in DOM parser, or we can use SimpleDOMparser library as a popular alternative. Built-in DOM in PHP is a bit sensitive, though, throwing errors if the elements are invalid or multiple IDs were found on the same page, etc. There are many others, for sure. Finally, we’ve settled with jQuery solution, both for simplicty and direct browser support (assuming your website project uses jQuery, that is – and 99,9% chances are it does! If not, you can temporarily include it in the header).
Instructions / How It Works?
jQuery parser traverses through entire HTML DOM tree and inspects each element in the Client [= your Browser] while page is still loading (rendering). Mind you — you need to be owner of the content, to inject the script code in the first place (oh, the irony… yes, we get it!). However, you can still manually execute javascript inside your console or via script browser extension, so, technically you can test any loaded website page out there.
1. Place the code at the bottom of your page, you can place it before closing </body> or </html> tag, for example.
2. Start DevTools [hit F12 key] with Console tab active and (re)load page. Check console for any potential warnings. If elements are larger than the html/body width, those elements will be in colored in red and throw a standard javascript console log error, asking for your attention to inspect them more closely. This is (possibly) the very same method of operation old ViewPort test was built upon in the original PageSpeed Insights tool.
jQuery Script: RESPONSIVE HTML ELEMENTS TEST CODE
<script type="text/javascript">
// place this function @ footer of your page/CMS, start DevTools (Dev Console) [hit F12 key], select Console tab and reload the page
// it will list all HTML elements (tags) with id/class names and their detected widths
// any element that has width larger than the width of body/html elements is potential candidate for view that falls outside ViewPort
// repeat test several times for different screen sizes: resize browser window manually in Chrome or use Mobile Device emulation with different models and screen orientations

// wait until entire document loads
$(window).on('load', function() {
    // to avoid false positives add some additional delay before run
    setTimeout(function() {
        $('*').each(function(index, element) {
            // log only visible elements
            // this avoids false positives like hidden responsive elements or script tags
            if ($(element).is(":visible") == true) {
                if ($(element).width() > $('body').width()) {
                    // debug entire html element content
                    console.error($(element).html());
                    // colorize in red all elements that potentially fall outside ViewPort
                    console.error(index + ' :: TAG ' + $(element).prop('nodeName').toLowerCase() + ' :: CSS ID ' + $(element).prop('id') + ' :: CSS CLASS ' + $(element).prop('class') + ' :: ' + $(element).width() );
                } else {
                    // regular report / low suspects
                    console.log  (index + ' :: TAG ' + $(element).prop('nodeName').toLowerCase() + ' :: CSS ID ' + $(element).prop('id') + ' :: CSS CLASS ' + $(element).prop('class') + ' :: ' + $(element).width() );
                }
            }
        });
    }, 0); // adjust run delay [ms]
});
</script>
Change Log:
* Code is updated to be compatible with jQuery version 1.8 or newer (older library versions should not be affected, as well). Initial opening line:
$(window).load(function() {
is replaced with:
$(window).on(‘load’, function() {
* Condition to test/report only visible elements is added (greatly reduces false positives)
if ($(element).is(“:visible”) == true) { … }
* Condition to report entire element content is added (greatly improves debugging procedure)
console.error($(element).html());
EXAMPLE OUTPUT
While jQuery ViewPort debugger script tool still cannot tell you with 100% certainty which element is the true cause of the ViewPort size being exceeded, it can still hint you with high probability which elements need your inspection. The elements which are listed first in the DOM tree are the natural suspects, while the following might be just a consequence of the preceding ones. Also, if you have scripts, iframes and other external content, it may report “script” elements as faulty.

jQuery HTML DOM Responsive Debugger Example
In order to get a more complete picture, you should resize your browser’s window to several common resolutions (320×480, 800×480, 1280×800 and alike) and repeat the test by simple page reload.
Also, in some cases, the issue may surface only in Mobile Emulation mode (small mobile device icon at the DevTool’s top left corner), so make sure to run those tests, as well.
CONCLUSION
We really hope that you will find this small utility useful.
And thanks to all in advance for potential improvements suggestions!


![Xiaomi App - How To Re-Install Stock Factory Version - How To Fix Corrupted Gallery App [no root]](https://tehnoblog.org/wp-content/uploads/2025/09/Xiaomi-Gallery-App-Code-Bugs-Artwork-1024x576.png)


Comments
Post A Comment