

Article Updated: 10 March 2017
A year ago we have wrote an article about unique ZB Block SPAM & SECURITY protection script. As every layer of added complexity to your website slows down it’s execution and serving time, you have to accept certain trade-offs and sacrifice performance for increased commodity and protection. In this article we will show you how you can exactly determine the amount of slowing down in your particular hosting setup.

WordPress Security Pro Tips
HOW TO MEASURE ZB BLOCK EXECUTION TIME
There are at least 2 variations where this code can be placed, depending on what exactly you wish to measure, but we will focus on ZB Block measurement alone in this article. For example, basic option (which will be demonstrated here) is to implement initial timestamp variable at the very beginning inside ZB Block main script file zbblock.php, and the second option is to implement it inside wp-load.php (or other bootstrap loader file of particular CMS).
STEP 1
Inside zbblock.php define new variable immediately after <?php opening tags:
$server_php_processing_time_benchmark_start = microtime(TRUE);
STEP 2
Inside zbblock.php copy/paste below code immediately before ?> closing tags:
// get end time

$server_php_processing_time_benchmark_end = microtime(TRUE);

// get time difference

$server_php_processing_time_benchmark = $server_php_processing_time_benchmark_end - $server_php_processing_time_benchmark_start;

// format time difference

$server_php_processing_time_benchmark = round($server_php_processing_time_benchmark, 4);

// generate benchmark output to file

$dir = dirname(__FILE__);

$benchmark_output = $dir.'/'.'benchmark-time.log';

// compositing log entry

$logentry = $server_php_processing_time_benchmark.PHP_EOL;

// append log entry to a file | try to create a log file if it not exists

$benchmark_output = fopen($benchmark_output, 'a');

@fwrite($benchmark_output, $logentry);

fclose($benchmark_output);
This code will measure ZB Block execution time from start to finish and save results inside benchmark-test.log file inside your /zbblock directory. Needless to mention, make sure that your ZB Block folder is writable.
The time results are rounded to 4 decimal places, to make it easier to read, but if your server is extremely fast, you might increase that number to a higher value.
HOW TO ANALYZE & READ RESULTS
Here is a small sample taken from our cheap budget extremely affordable VPS server benchmark (1 x vCPU / 256 RAM / SSD cached / Ubuntu 14.04 / PHP 5.5.x):
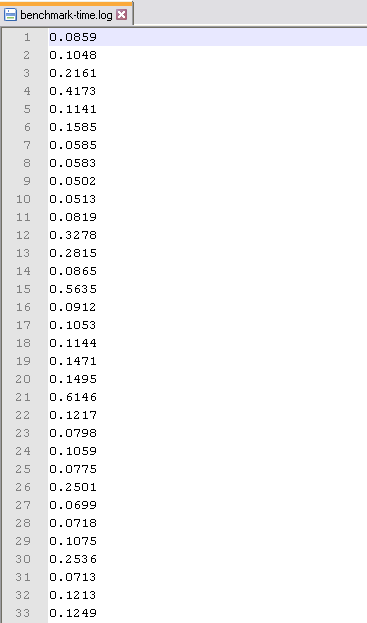
ZB Block Execution Time Server Performance Benchmark
If you calculate the average value from above small data sample (in e.g. Excel spreadsheet), you will get a value of 0,161 seconds, which is not that bad, but not exactly lightning fast, either. Of course, you cannot expect much from a server that costs something like $1/month, right?
After a ~ 24 hours period we’ve collected enough samples to draw a histogram chart in Microsoft Excel spreadsheet and more precisely calculate average processing time value and get more meaningful insight of our server performance. Take a look:
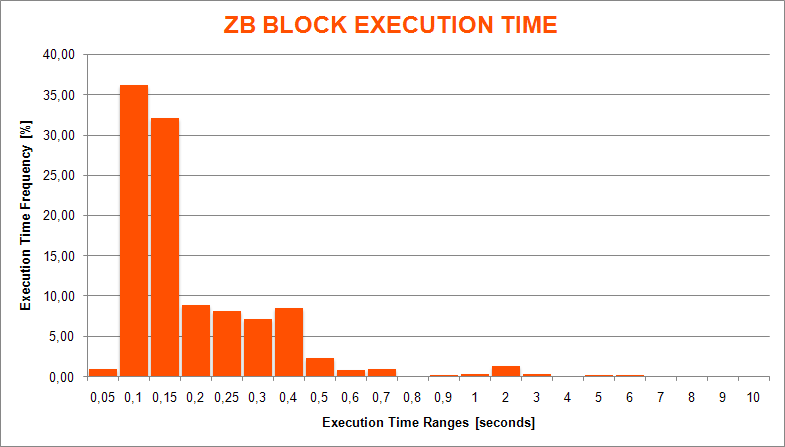
ZB Block Execution Time Histogram Chart (OpCache OFF)
The average value is now 0,198 seconds (or ~ 0,2 seconds), which is, well, more than we would like it to be, but this is a limitation of our server we have to live with for now. There could be some optimizations inside ZB Block code that could reduce this time.
From the chart we can see that over 70% of total number of requests processed are finished within 0,15 seconds (150 milliseconds), which is great. Majority of remaining requests are finished for 0,4 seconds or lower (400 milliseconds), and few spikes in the whole seconds range are rare and affected by some internal or external factors discussed below.
The above was tested with OpCache disabled (turned OFF).
The results changed considerably with OpCache enabled (turned ON):
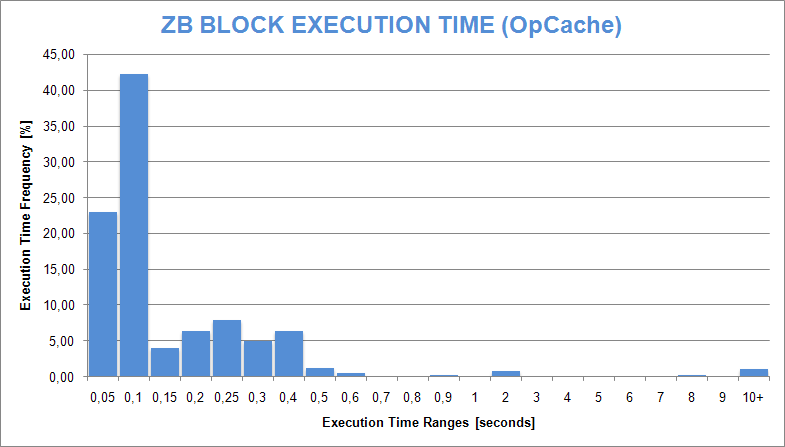
ZB Block Execution Time Histogram Chart (OpCache ON)
The average value was lowered to 0,17 seconds, and 65% – majority of requests were processed under 0,10 seconds (100 milliseconds). As in the first setup, over 75% of requests were processed under 0,2 seconds, but the overall weight of the chart is shifted to 0,05 and 0,10 seconds groups, respectively.
UPDATE
We’ve moved to a more powerful VPS server in the meantime, and upgraded server software (apache/mysql/php) to their latest versions, so here’s the benchmark of the new environment for comparison (4 x vCPU / 1 GB RAM / SSD cached / Ubuntu 16.04 / PHP 7.x):
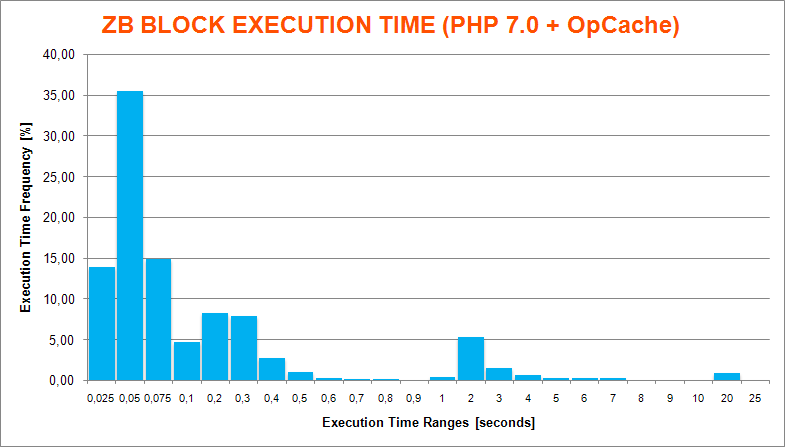
ZB-Block Execution Time Histogram Chart PHP-7 OpCache 4xCPU VPS
Since PHP 5.5.0 OpCache is enabled by default, we didn’t test it without caching disabled (side note: we’ve noticed that in most shared hosting environments running on CloudLinux, OpCache is indeed disabled by default, so you have to manually enable it. Probably in order to save on shared RAM, as OpCache consumes/reserves portion of existing memory to run).
The boost in speed is obvious, almost 70% of all incoming requests were processed under 0.1 seconds, 77.5% of total requests were processed under 0.2 seconds, but what we don’t like is the 2-seconds area on our histogram chart, which accumulated considerable amount – almost 8% of requests were processed between 1 and 4 seconds range, which indicates either some issue with VPS Node or server (as it happens in regular intervals). Another peculiar point is around 20 seconds mark, which also shows that on occasion some requests take too long to complete. Test was conducted in the span of over a week, taking around 10000 sample points, it’s a pretty accurate measurement.
However, this does not mean that ZB Block script is slow, long times here can simply reveal or indicate server/node issues, expected with cheap hosting plans.
CONCLUSION
Google recommends that server response time falls within first 200 milliseconds, but this only affects actual request serving. ZB Block will definitely add to the overall overhead and slow down your page loading for a fraction of the second, but on the other hand, your server load will be severely reduced due to the fact that many bots, server and cloud services will be blocked from accessing and draining your bandwidth, CPU, RAM and PHP/Server/MySQL processes.
As you can see, the execution time greatly varies, and several contributing factors must be taken into account:
- PHP version used may create huge impact (we are running 5.5.9, newer 5.6x or 7.x should be faster)
- OpCode caching can improve results and reduce processing time, if your server supports it and has enough memory available
- We are using custom badip.inc signatures database over 3x larger than latest beta version available
- Server load generally varies at any given point in time (incoming traffic/requests, internal CRON jobs etc.)
- VPS Node overall load (external factor)
- Our server is hosting several websites, not just one
- ZB Block execution flow will vary depending on triggered signatures and ban rules
There is no free lunch in the end and you have to sacrifice performance in order to gain some peace of mind.


![Xiaomi App - How To Re-Install Stock Factory Version - How To Fix Corrupted Gallery App [no root]](https://tehnoblog.org/wp-content/uploads/2025/09/Xiaomi-Gallery-App-Code-Bugs-Artwork-1024x576.png)


Comments
Post A Comment